

Reporting and Dashboards
Make your compliance visible, measurable, and exportable. A.ID gives you real-time dashboards, structured data exports, and customizable reports — so you always know what’s happening and can prove it when needed.
Live Dashboards: Compliance at a Glance
Track the metrics that matter most — in real time
01
Pre-configured Dashboards
Monitor key KPIs: onboarding status, risk levels, case load, and more
02
Custom Personal Dashboard
Build views tailored to your team, region, or risk model
03
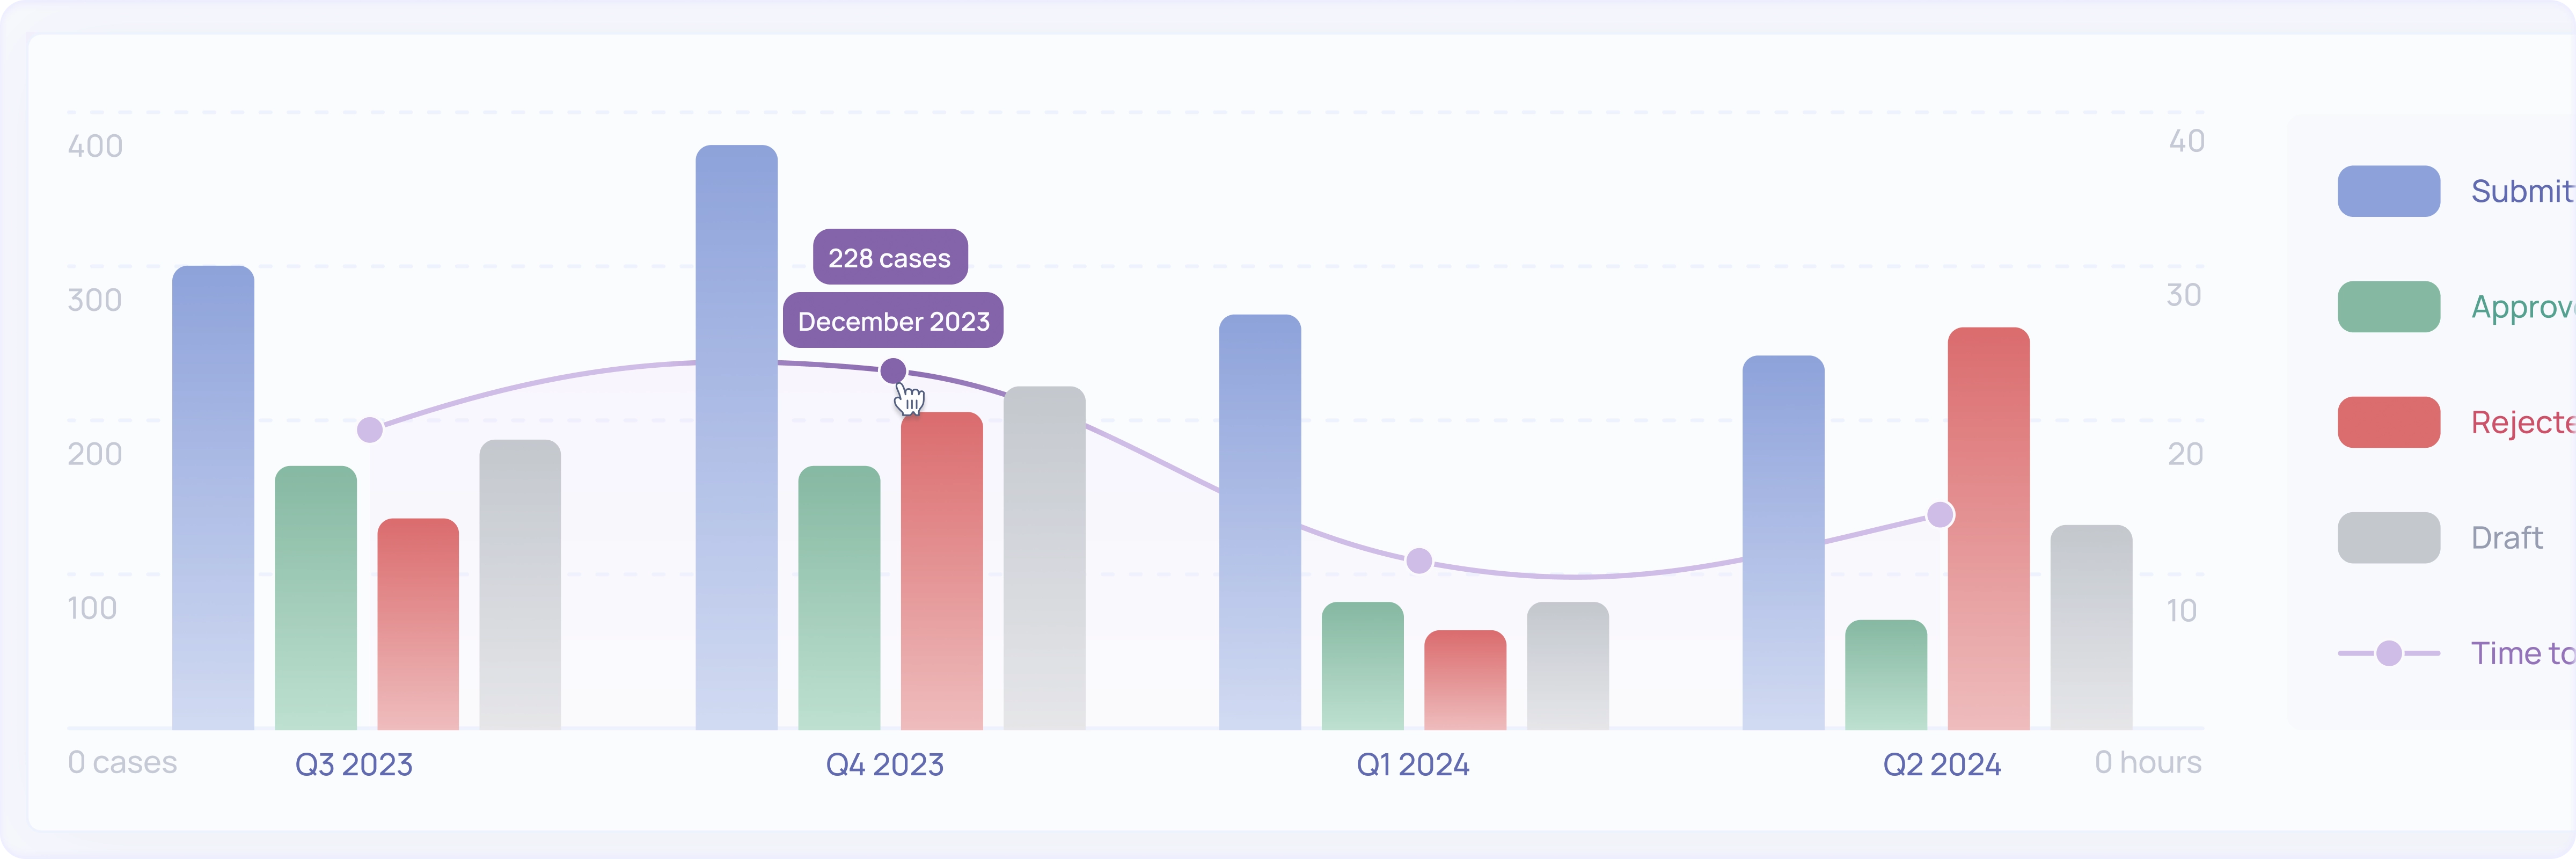
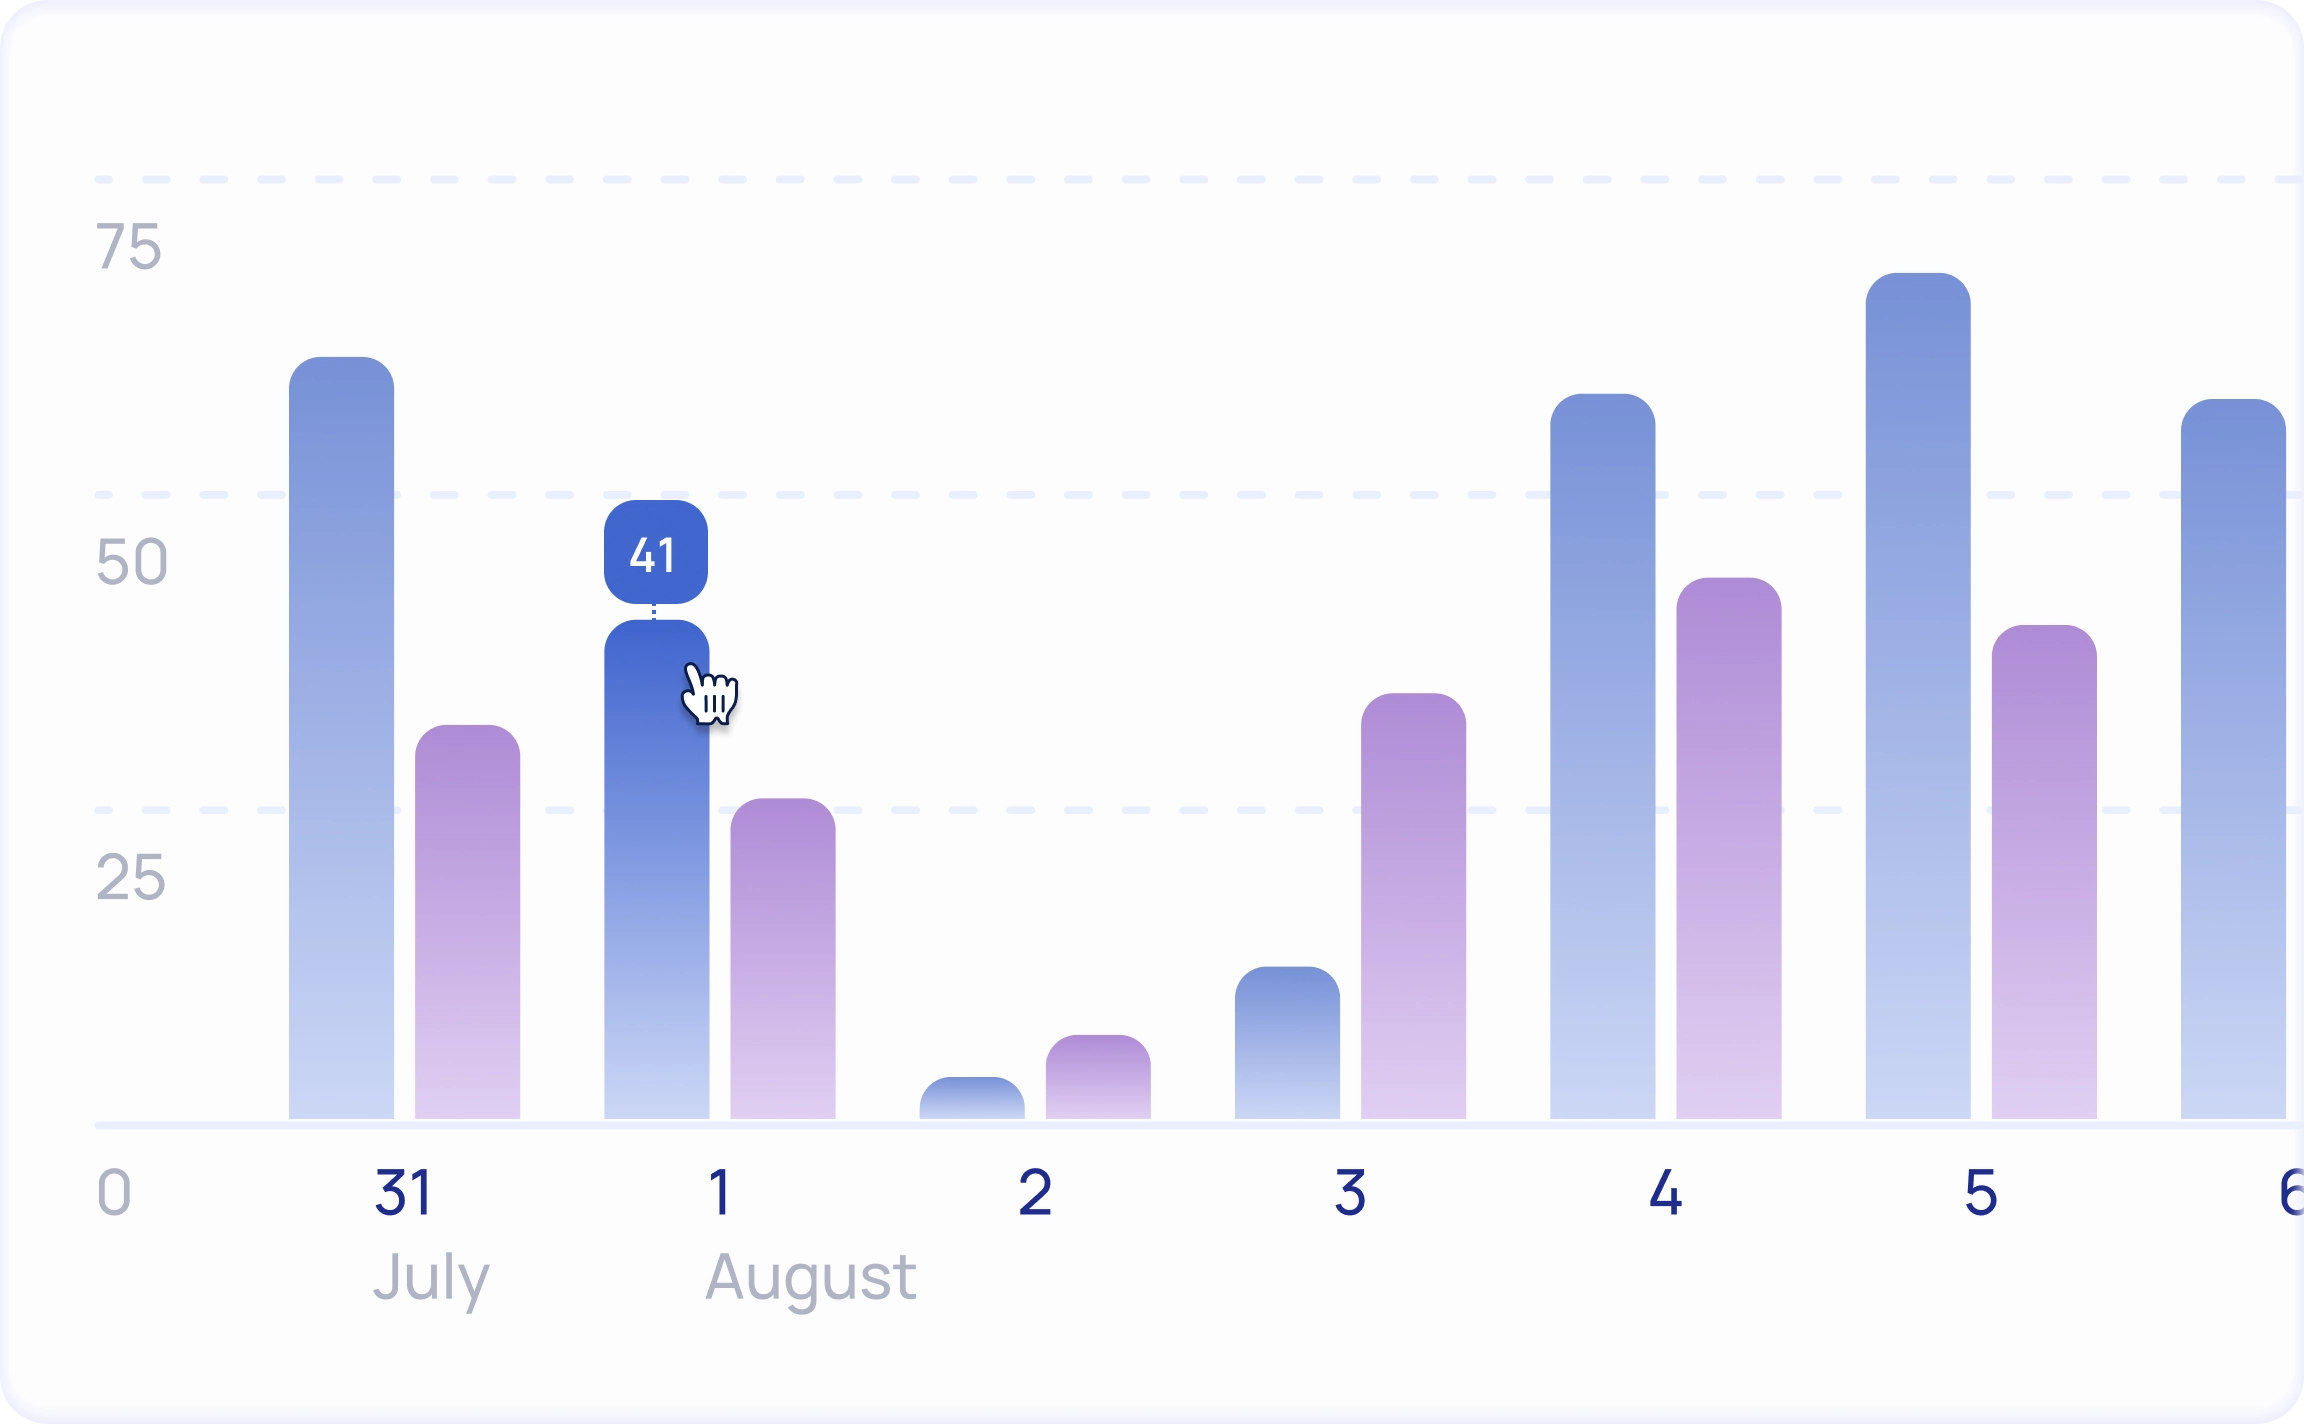
Visual Insights
Graphs, charts, and timelines for fast situational awareness
04
Entity-level and System-level Reporting
Zoom into one case or roll up to see trends across your entire ecosystem


A.ID transforms raw compliance data into real-time insight through a powerful reporting system and modular dashboards. From quick overviews to deep operational analytics, every dashboard is designed to support fast decision-making, audit readiness, and ongoing performance improvement — across teams, processes, and entity types. With both out-of-the-box views and customizable widgets, teams can monitor key metrics, track bottlenecks, identify risk patterns, and optimize workflows — all from one intuitive interface.


Data Exports: Your Data, Your Format
Export exactly what you need — for regulators, audits, or internal analysis
Structured data can be exported in multiple formats — including PDF, CSV, and XLSX — to meet internal, regulatory, or audit requirements. Exports are configurable, role-controlled, and aligned with the platform’s permission model, ensuring both flexibility and compliance.
PDF Exports
Polished, formatted reports for client files, case summaries, or review documentation
XLSX & CSV Exports
Structured data dumps for custom analysis or data science pipelines
Scheduled or On-demand
Export anytime or automate recurring reports
Key Metrics and Statistics: Always Audit-ready
Always audit-ready. Always in control.
Dashboards provide real-time visibility into core compliance metrics — including case volumes, processing times, verification outcomes, and rejection reasons. Data is structured, exportable, and ready for audit or internal reporting at any moment, supporting transparency and operational oversight
Workflow Efficiency
Time to review, escalation frequency, case aging
Screening Statistics
Match rates, false positives, resolved alerts
Risk Distribution
Client risk tier breakdowns over time
Activity Logs
Who did what, when, and how


A.ID Europe UAB | Savanoriu avenue 6, Vilnius, LT-03116, Lithuania
© 2026 A.ID Europe UAB. All rights reserved